Improve Your Website Traffic Using Google Analytics
Do you understand your website traffic?
Have a website? Do you know how much traffic it gets?
If you said YES, … Awesome! But have you mastered it? More on that point coming soon in Master Your Google Analytics.
If you said NO, then why not? Your website is the face of your business in today’s digitally advanced world. If your mother was anything like mine, then I bet, more than once, you were told,
“You only get 1 chance to make a good first impression” – Mom
If you have to make a quick decision on who you want to operate on you, what’s the first impression leave you with as to who you want operating? It may or may not be factual, but the first impression counts! It counts on the web for sure!

Why wouldn’t want to know how your website is performing? Even if you don’t make a great first impression, you still may be able to win over your potential customer by building trust.
Does your website make a good first impression or are visitors scared and running away!? To answer this question, you need to know how to read and understand your Google Analytic data.
Let’s make sense of that data
Let’s take a look at your Google Analytics Dashboard; it will look similar to the image below:
Google Analytics is a FREE service that provides comprehensive statistics regarding website visitors. Data available through this service consists of site visits, page views, bounce rate, average time on site, pages per visit and percentage of new visits.
Google Analytics can track referral traffic including search engine, direct visits, website referrals and marketing campaigns (Pay Per Click, Banner advertising, e-mail marketing, etc.)
Now let’s dig into understanding the Dashboard:

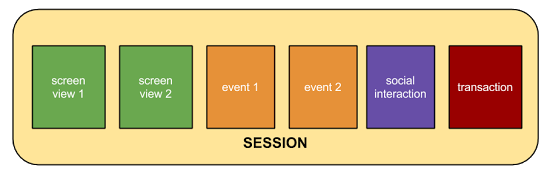
Sessions:
A session is a group of interactions that take place on your website within a given time frame. For example, a single session can contain multiple screens or page views, events, social interactions, and/or e-commerce transactions.
Users:
Users are viewers that have had at least 1 session within the selected date range. This includes both new and returning users.

Pageviews:
Pageviews is the total number of pages viewed. Repeated views of a single page are counted.
Pages/Sessions:
Pages/Session (Average Page Depth) is the average number of pages viewed during a session. Repeated views of a single page are counted.
Avg. Session Duration:
Avg. Session Duration is the average length of a Session (a session is 1 visit to the website).
Bounce Rate:
Bounce Rate is the percentage of single-page visits (i.e. visits in which the person left your site from the entrance page without interacting with the page). Lower bounce rates are desired!

Most website analysts consider a Bounce Rate of 40% or lower ideal! So if your website is within the 40% rule, you know it’s performing well. If your website is above the 40% bounce rate, here are a few things you can do to improve your site:
- Make sure your site is Mobile Friendly. As of May 2015, more online searches are done from a mobile device than a desktop. Source: (http://searchengineland.com/its-official-google-says-more-searches-now-on-mobile-than-on-desktop-220369)
- Make sure your information or products can be accessed with no more than 2 to 3 clicks. Make your website easy to navigate.
- Make sure to include images, today’s digital audience is very visual and image driven.
A month after your website is mobile friendly, easy to navigate (user-friendly), and has images, check your Google Analytics to see if your bounce rate has improved.

% New Sessions:
The % new sessions is a measure of new visitors. (It doesn’t count a person who comes back more than 1x.)
Use this information to improve your website by understanding its traffic!
Understanding the basic metrics of Google Analytics is key to understanding how your website is performing. Because, like I said earlier, you only get one chance to make a good first impression. Make sure you take advantage of Google Analytics to develop your digital presence!
If you’d like to learn more and go into advanced uses of Google Analytics or even schedule a workshop on Google Analytics, please let me know by emailing joe@digitalhill.com.