Introduction to Tracking Effectiveness of your Online Marketing
Most growing companies recognize the important of having a strong online, digital presence.
 Potential and existing customers are searching for information online, mobile web use for finding information prior to purchase continues to grow, and social media networks have reached a tipping point where more participate than don’t participate. Once a company has their website, blog, and social media properties in action, the key becomes how to measure and improve the performance of these different areas.
GOOGLE ANALYTICS:
A valuable way to begin measuring is to use a free tool like Google Analytics.
 With Google Analytics added to a company website and blog, a company can measure and watch changes in traffic to the website, time spent on the site, how traffic came to the site and more. I’ll review a few features within Google Analytics that can offer valuable insights and data as a first step in tracking the effectiveness of your online marketing.
To reiterate, Google Analytics is a free tool. It does require adding a select piece of custom code they provide to your website and blog. Once installed, this provides the means for Google to deliver analytics to you via your private dashboard. A few key areas to review include:
Audience
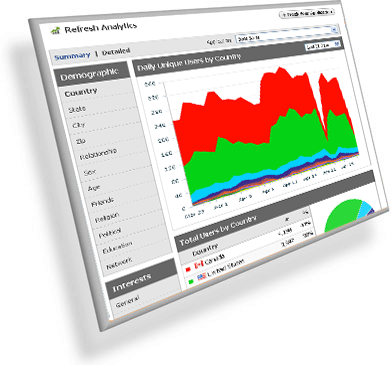
In this area you are able to view by date range the number of visitors to your site, as well as unique visitors (some visitors will come back more than once, so a unique visitor is counted once). Other important details in this area are ability to see where your traffic is coming from, including ability to drill down to view by city where traffic is coming from. There is also a breakdown of type of device a visitor is using such as a desktop, tablet, or mobile phone. This is helpful to track over time to understand trends and inform how you make website updates.
Also within the Audience area is ability to see how many pages a visitor views during their visit and the time length they spend on the site. A goal over time would be to increase the number of pages a visitor views and to also see an increase in their time on the site. The more pages they view and the more time they spend on the site is an indicator of stronger interest in what your company offers.
Traffic Sources
This allows you to see where your traffic came from right before coming to your site. As well, you can see keywords that users searched on to reach your site. This is informative and can help guide the type of content you write more of in future blog posts. The traffic can be broken down into details such as how many came from Google organically (not through an ad); how many came to your site through a Google Ad (paid search); and other sources such as Facebook and Twitter. Over time this helps you understand how your marketing on those other platforms and possibly ads you are running on Google or Facebook are impacting traffic to your site.
Content
The content section allows you to see what content had the most traffic in a given time period. It includes ability to find any page or blog post and see the amount of visitors who viewed that page. This, of course, is helpful to enable a company to view what pages on the site were most popular and if ads were being used to drive traffic, whether those ads spark more traffic to the page that was specified. Viewing the statistics on content popularity over time can help inform what is of interest and priority to visitors that can impact future content and marketing strategy.
This is a very basic overview of the power and potential a tool like Google Analytics offers companies. There are many more features that can be used, The key, however, is regular review and watching for trends and results based on your company’s digital marketing plans, followed by making adjustments to improve one’s marketing and content based on the findings.