How to Customize Your Google Analytics Dashboard
 Customize your Google Analytics Dashboard for Social Media traffic, Mobile Stats, and Demographics
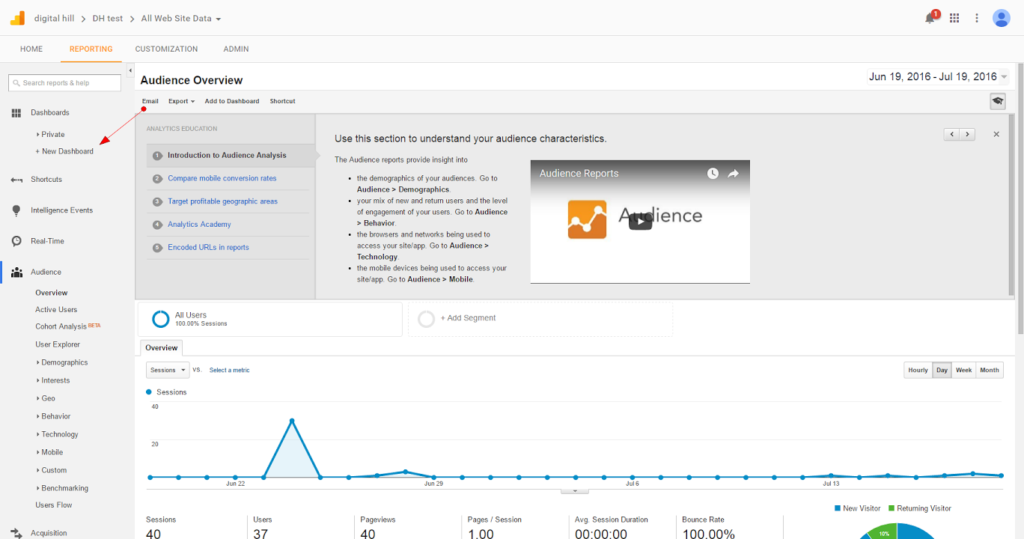
In Google Analytics, you receive a generic dashboard. It displays the metrics Google thinks are most important about your website in an easy to understand graphic format; the location of your website visitors, the number of users visiting your site and your bounce rate.
Because each of these displays has several factors, you can understand the statistics. The factors for bounce rate, as an example, could include lack of a mobile-friendly website, website speed, and other which show you why users leave your site without visiting a second page.
The same kind of breakdown for any metric can be invaluable. It shows the causes and statistics and then you can take action. The reason to create custom dashboards is to focus on the important metrics.
Here’s how to create custom Google Analytics dashboards to display your sales and marketing traffic, mobile statistics, and demographics.
Creating a custom dashboard
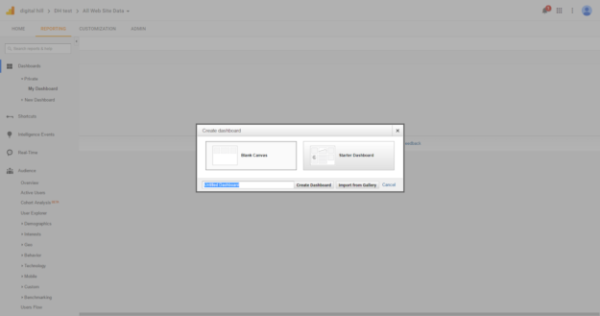
- Select a canvas – On the Dashboards menu, click on the New Dashboard option. You’ll immediately be given a choice to use a starter dashboard with some sample widgets, or to start with a blank canvas.
Since you’re customizing for a specific metric, you’ll want to start with a blank canvas.
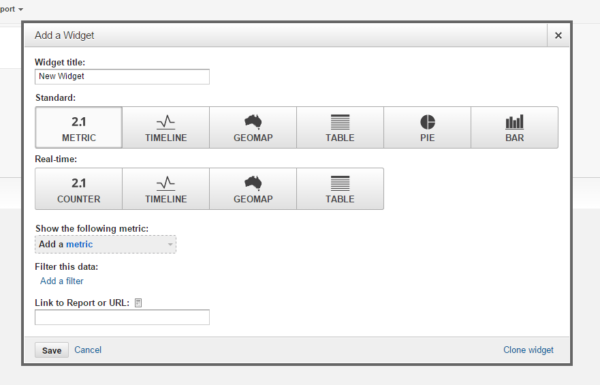
- Add a widget type – The next step is to click on the Add Widget option displayed on the menu bar at the top. There are 6 different types of widgets which can be displayed. These simply refer to the graphic format you want data presented in. The possible types are geo map, timeline, table, pie chart, bar chart, and metric. You should give your widget a name, so it’s clear exactly what type of information is being displayed.
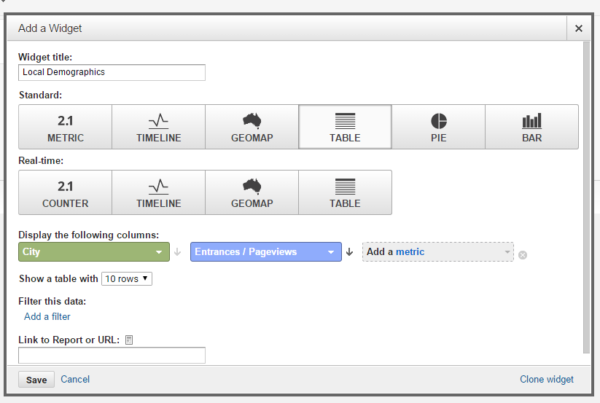
- Choose Google Analytic dimensions and metrics – Keep in mind that dimensions are attributes which describe the data you want to display. Metrics are numbers which count that data. Using these 2 components, you can tailor your widget to display the data you want to analyze. For instance, demographics of website visitors, sources of your sales and marketing traffic, or the kinds of mobile devices used by your site visitors. Be aware that the types of dimensions and metrics you choose from Analytics drop-down lists will be tied to the kind of widget you are building. Widget type governs the choices you have for dimensions and metrics. In the same way, the kind of drop-down metrics available for selection is tied to the kind of dimension you’ve chosen to describe.
Google Analytics Dashboard are an incredible business resource
Creating custom dashboards in Google Analytics is a valuable resource. They clearly display important stats about your website and point to areas for improvement.
Dashboards are very easy to build. If you ever get stuck, make use of Google Help to get yourself back on track.